Data visualisation tool
Data visualisation tool created for designers who don’t code.
Kiln has designed a data visualisation tool which anyone can use to tell rich data-driven stories.
Data visualisation company Kiln has designed and developed a new program which allows people with no coding skills to create advanced data-driven storytelling visuals.
The Flourish platform is aimed at designers, analysts, marketers, journalists, or anyone who needs to make interactive visualisations.
“It’s particularly relevant for people with design but not coding skills,” according to Kiln co-founder and CEO Duncan Clark who says, “Previously this would only have been available to high end coders.”
“Empowering graphic designers”
Rather than engaging a coder, the process involves choosing a template, adding in data and configuring colour settings. After this more options can be bolted on.
“This means that graphic designers can be empowered to use their skills to customise a model they’d only otherwise be able to take control of if they were a coder,” says Clark.
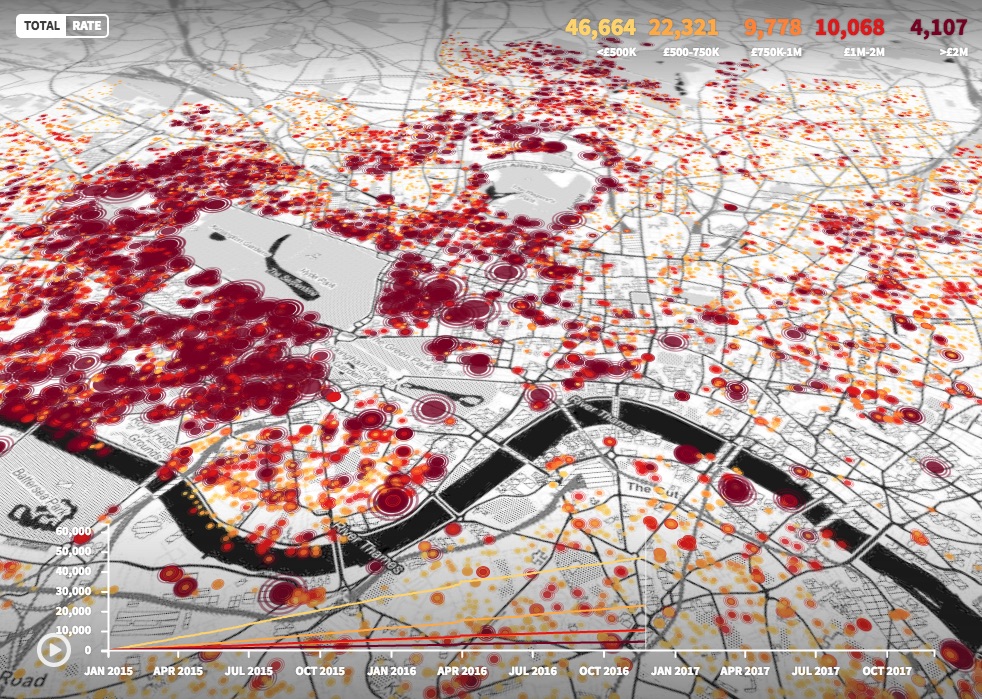
The kinds of data visualisations available include time-tracking maps, 3D globes and advanced charts.
More efficient
Clark says that the benefits are that it would normally take weeks of work “and cost tens of thousands” to engage an agency, which can be “too slow and expensive”.
Beta clients have included “journalists in a news room who want to map points of interest relating to a story” as well as “agencies who are supplying content to a client” he adds.
Developer tools have been created so that any developers can make new templates. These developers might then give them away or sell the new templates.
Ref: www.designweek.co.uk